A Practical Intro to Analytics Engineering with dbt
What dbt actually does and why teams adopt it: the staging, intermediate, and marts layering pattern, a worked model, and how tests and docs turn raw SQL into a trustworthy product.
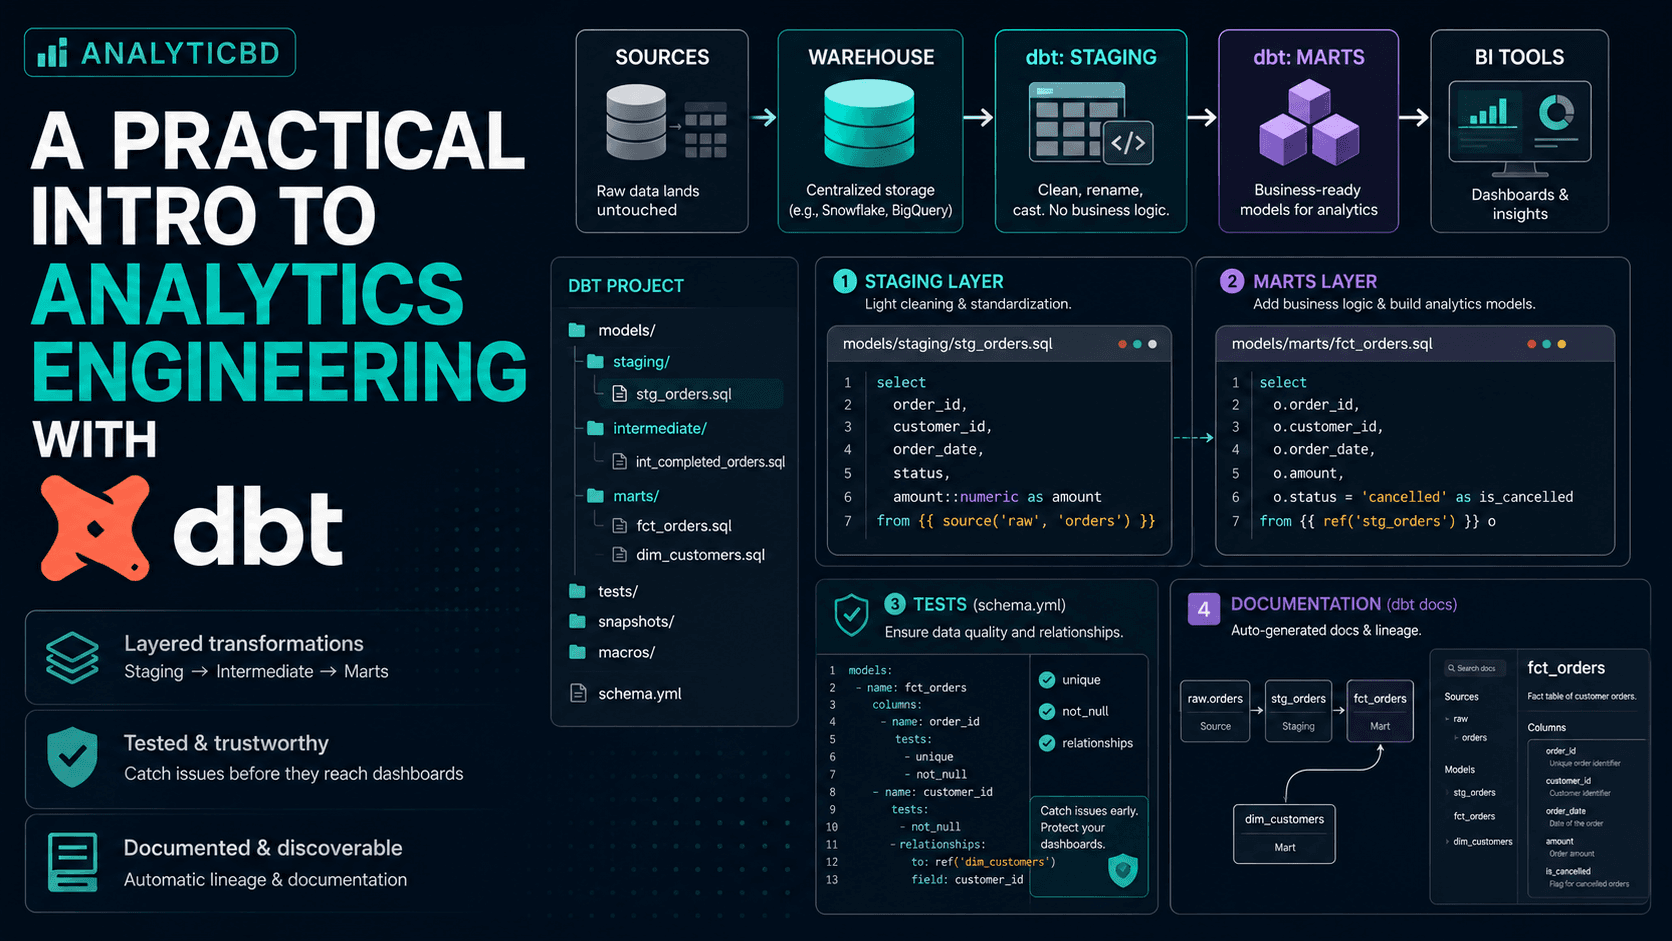
The problem dbt solves
Before analytics engineering had a name, most teams had one giant folder of SQL scripts — some run manually, some by a cron job nobody remembered setting up, none of them tested. dbt's contribution wasn't a new query language; it's applying ordinary software engineering practice (version control, testing, documentation, modular reuse) to the transformation step between your warehouse and your BI tool.
The modern data stack in one diagram
Rendering diagram…
Raw data lands in the warehouse untouched. dbt owns everything from that point forward — it doesn't extract or load data, it transforms what's already there.
Layering your models
- Staging — one model per source table. Light renaming and casting only: no joins, no business logic. If a source column is called
cust_id, staging is where it becomescustomer_ideverywhere downstream. - Intermediate — reusable business logic that more than one mart needs (a "completed orders only" filter, for instance).
- Marts — the tables analysts and dashboards actually query. Wide, denormalized, named after the business concept they represent (
fct_orders,dim_customers).
A worked example
Staging layer — just cleans up the raw source:
-- models/staging/stg_orders.sql
select
  order_id,
  customer_id,
  order_date,
  status,
  amount::numeric as amount
from {{ source('raw', 'orders') }}
Marts layer — builds on staging, adds the business logic:
-- models/marts/fct_orders.sql
select
  o.order_id,
  o.customer_id,
  o.order_date,
  o.amount,
  o.status = 'cancelled' as is_cancelled
from {{ ref('stg_orders') }} o
Notice the marts model references {{ ref('stg_orders') }}, not the raw table — that's what lets dbt build a dependency graph automatically and run models in the right order.
Tests are not optional
# models/marts/schema.yml
models:
  - name: fct_orders
    columns:
      - name: order_id
        tests:
          - unique
          - not_null
      - name: customer_id
        tests:
          - not_null
          - relationships:
              to: ref('dim_customers')
              field: customer_id
Tip: Start every model with
uniqueandnot_nullon its primary key. It costs two lines of YAML and catches the single most common failure mode — a join that silently duplicated rows — before it reaches a dashboard.
Documentation comes free
Every model and column can carry a description in the same schema.yml file, and dbt docs generate turns that into a browsable, searchable site with the full lineage graph. The discipline this creates matters more than the tool: a mart nobody can explain is a mart nobody should trust.
When dbt is (and isn't) the right call
dbt earns its complexity once you have more than a handful of models, more than one person writing SQL against the warehouse, or transformations that genuinely need to run on a schedule with dependencies between them. For a single analyst running ad hoc queries, plain SQL views and a disciplined naming convention get most of the same clarity without the tooling overhead — the practice (layering, testing, documenting) is what actually improves data quality, and you can start applying it before you adopt any specific tool.
Key takeaways
- Staging → intermediate → marts is the layering pattern almost every dbt project converges on.
ref()andsource()are what make the dependency graph — and safe run ordering — automatic.- Tests and docs are cheap to add and are what actually make a model trustworthy, independent of which tool enforces them.
The E-commerce Order & Revenue Analytics project applies this same staging-then-business-logic layering pattern, just in plain SQL and Python instead of dbt.
Enjoyed this post?
Get new analytics tutorials in your inbox.
Related articles
Turning a Vague Request Into an Analysis Brief
Most wasted analyst effort comes from the gap between the request someone makes and the decision they are trying to make. Four questions that close it, the short brief that converts your assumptions into theirs, and how to handle the answers you will actually get.
Measures vs Calculated Columns in Power BI
The same formula written two ways behaves completely differently. Row context versus filter context, why averaging a margin column is wrong, the memory cost of stored columns, and a one-sentence rule for choosing correctly.
Slowly Changing Dimensions, Explained Without the Jargon
When a sales rep changes team, should last quarter's numbers move with them? That question decides your dimension design. Type 1 versus Type 2 in plain terms, the join mistake that silently loses rows, and how dbt snapshots handle it.