Five DAX Patterns Every Power BI Analyst Should Know
Five practical DAX patterns for Power BI: measures vs. calculated columns, year-to-date and year-over-year time intelligence, running totals, and dynamic ranking with RANKX.
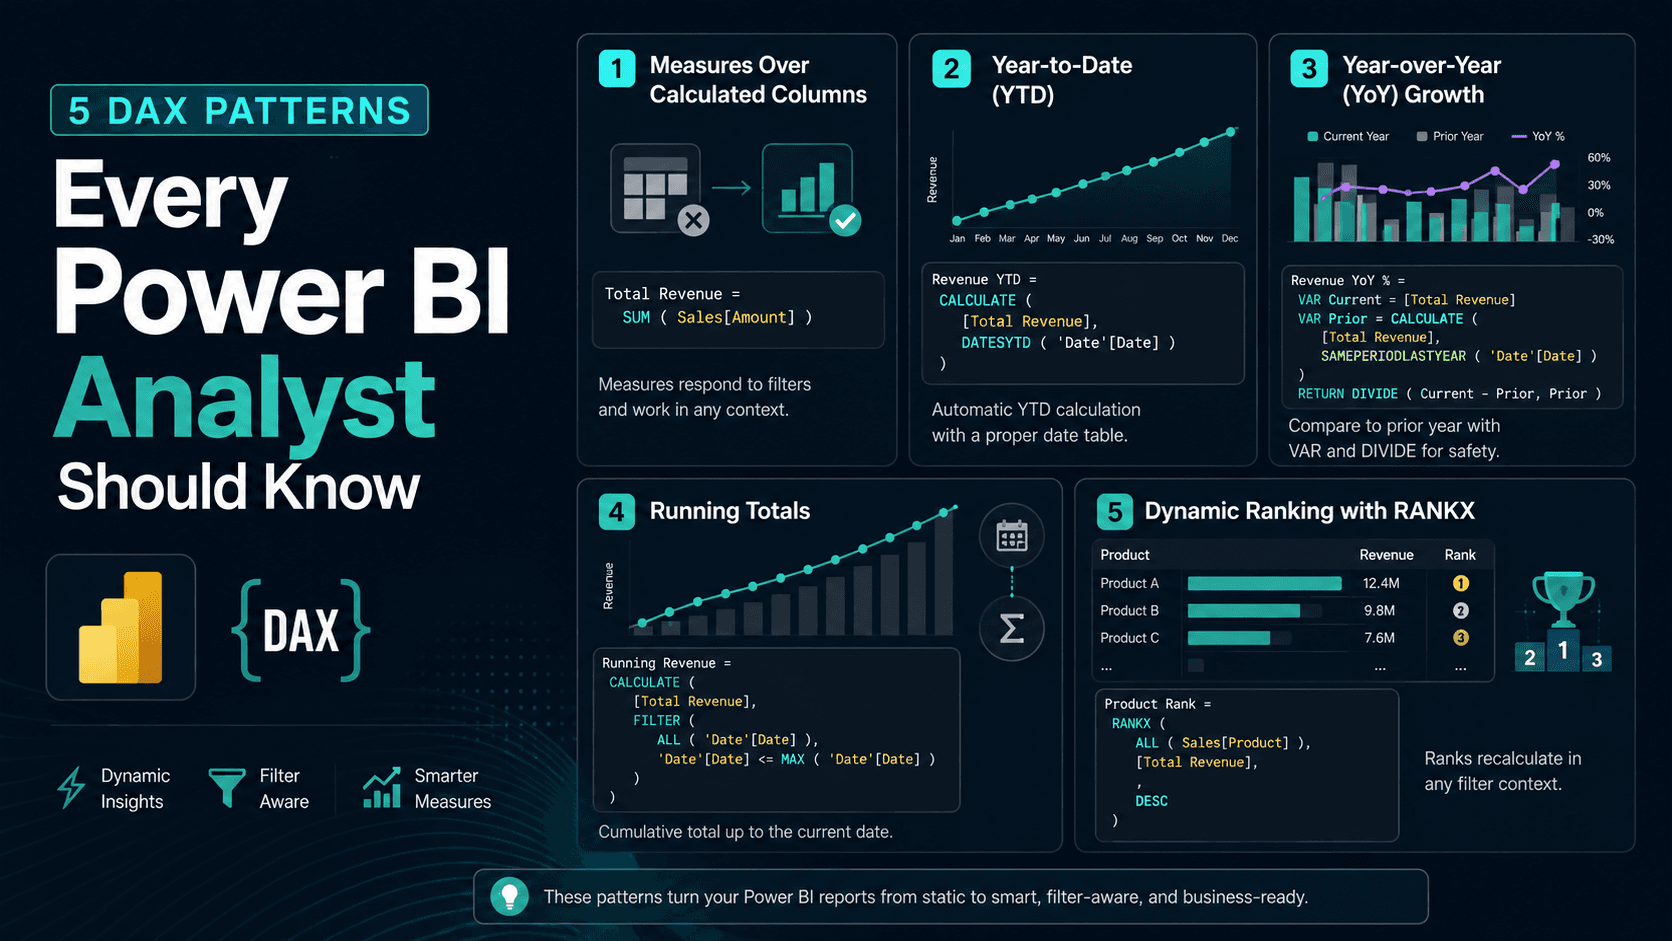
Pattern 1 — Measures over calculated columns
As a rule: prefer measures. A calculated column is computed once and stored in every row of your model, whether or not a report ever uses it. A measure is computed on the fly, in the filter context of whatever visual is displaying it — which is also what makes it correct when a user slices by a different dimension.
Total Revenue = SUM ( Sales[Amount] )That single measure works whether the visual is sliced by country, product, or nothing at all. A calculated column trying to do the same job would need to guess the filter context in advance, which it can't.
Pattern 2 — Year-to-date
Revenue YTD =
CALCULATE (
    [Total Revenue],
    DATESYTD ( 'Date'[Date] )
)
CALCULATE is DAX's context-modifier function — it takes an existing measure and evaluates it under a different filter than the one the visual would normally apply. DATESYTD generates that date range automatically, provided you have a proper marked date table (Power BI's automatic date hierarchies don't count — a real date table is worth setting up early).
Pattern 3 — Year-over-year growth
Revenue YoY % =
VAR Current = [Total Revenue]
VAR Prior = CALCULATE ( [Total Revenue], SAMEPERIODLASTYEAR ( 'Date'[Date] ) )
RETURN DIVIDE ( Current - Prior, Prior )
Two things worth copying here regardless of the specific calculation: naming intermediate values with VAR instead of repeating [Total Revenue] three times, and using DIVIDE() instead of the / operator — DIVIDE returns BLANK() on a divide-by-zero instead of an error that breaks the whole visual.
Pattern 4 — Running totals
Running Revenue =
CALCULATE (
    [Total Revenue],
    FILTER (
        ALL ( 'Date'[Date] ),
        'Date'[Date] <= MAX ( 'Date'[Date] )
    )
)
ALL('Date'[Date]) removes the existing date filter so you can rebuild it yourself; the FILTER then keeps every date up to (and including) the current row's date. This is the DAX equivalent of the SQL rows between unbounded preceding and current row window frame — same concept, different syntax.
Pattern 5 — Dynamic ranking with RANKX
Product Rank =
RANKX (
    ALL ( Sales[Product] ),
    [Total Revenue],
    ,
    DESC
)
A table visual sorted by a revenue column looks ranked, until someone filters by region and the sort silently stops reflecting a true rank within that filter. RANKX recalculates against the current filter context every time, so the rank stays correct no matter how the report is sliced.
Summary
| Pattern | DAX function | What it replaces |
|---|---|---|
| Measures over columns | SUM, AVERAGE, etc. | Calculated columns that don't respond to filters |
| Year-to-date | CALCULATE + DATESYTD | Manually filtered YTD queries per report |
| Year-over-year | CALCULATE + SAMEPERIODLASTYEAR | Two separate visuals a user has to compare by eye |
| Running totals | CALCULATE + FILTER + ALL | A SQL window function, reimplemented in DAX |
| Dynamic ranking | RANKX | A static sort that breaks under filtering |
A clean, marked date table is the foundation every time intelligence pattern above depends on — it's worth building before writing a single measure.
Where this shows up in practice
The Retail Sales Performance Dashboard project uses RANKX for product ranking directly; the E-commerce Order & Revenue Analytics project uses the same CALCULATE-based pattern for its run-rate revenue forecast.
Enjoyed this post?
Get new analytics tutorials in your inbox.
Related articles
Turning a Vague Request Into an Analysis Brief
Most wasted analyst effort comes from the gap between the request someone makes and the decision they are trying to make. Four questions that close it, the short brief that converts your assumptions into theirs, and how to handle the answers you will actually get.
Measures vs Calculated Columns in Power BI
The same formula written two ways behaves completely differently. Row context versus filter context, why averaging a margin column is wrong, the memory cost of stored columns, and a one-sentence rule for choosing correctly.
Slowly Changing Dimensions, Explained Without the Jargon
When a sales rep changes team, should last quarter's numbers move with them? That question decides your dimension design. Type 1 versus Type 2 in plain terms, the join mistake that silently loses rows, and how dbt snapshots handle it.